Difference between revisions of "Olena/MilenaDemoGraphRag"
From LRDE
(Upload olena web site) |
(Add the OlenaMenu on each Olena pages) |
||
| Line 1: | Line 1: | ||
| + | {{OlenaMenu}} |
||
| + | |||
Source file is accessible [https://trac.lrde.epita.fr/olena/browser/milena/demos/graph/region_adjacency_graph.cc here]. |
Source file is accessible [https://trac.lrde.epita.fr/olena/browser/milena/demos/graph/region_adjacency_graph.cc here]. |
||
Revision as of 18:41, 24 February 2014
Resources
Source file is accessible here.
An online demo is available here.
The aim of this demo is to show how to construct a region adjacency graph.
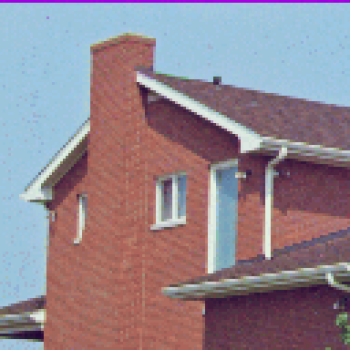
Input is house.png:
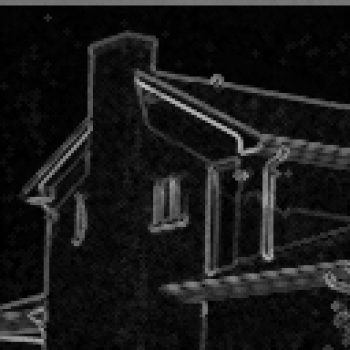
Compute the gradient of the picture.
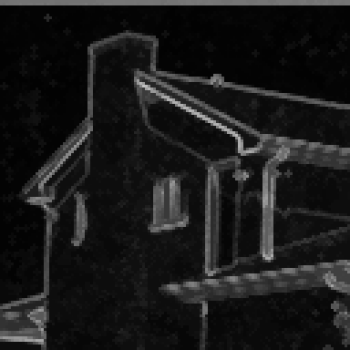
Run a morphological closure on the gradient output.
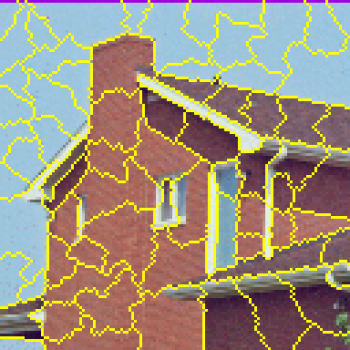
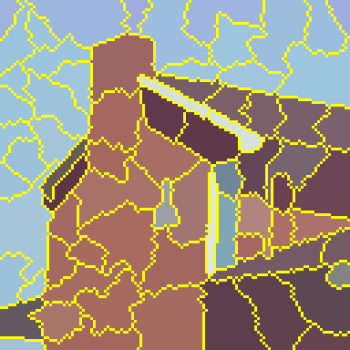
Then run a watershed flooding on the morphological closure result. Here is the input image in which the watershed line have been drawn.
For each basin, the value is set to the mean color.
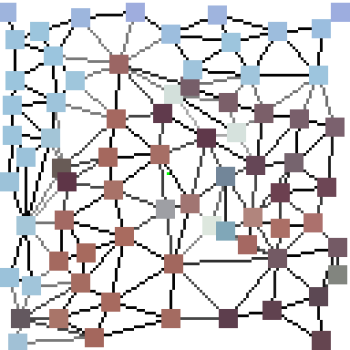
A Region Adjacency Graph (RAG) is built from the watershed flooding result. Then, a graph vertex image is built from the graph and the input image. Graph vertex image topology is based on a graph. Each graph vertex is mapped to a site, here the mass center of a basin. The site value is set to the mean color of the corresponding basin. Likewise, in graph edge images each graph edge is mapped to a site, here a pair of basin mass centers. The site value is actually the distance between two vertex values.
The following image is generated from a graph vertex image and a graph edge image.

