
TP 1 - Mandelbrot
Fall 2022
This TP serves as an introduction to SIMT programming style with CUDA. It consists in generating an image corresponding to the Mandelbrot fractal as fast as possible using CUDA. In this practical, you will discover many computational patterns and see how to map then on GPUs.
If you decide to use your own computer, you can, but we do not provide any support. So you must install everything by yourself before the practical.
You must have NVidia - GPU
$ lspci | grep -i nvidia
Install the CUDA Toolkit (Driver, Tools (compiler + profiler) and Samples). Follow the installation guide till the end. In particular, you shall succeed the step 7.2.3. Verify the Installation
You need:
Download and build the project files gpgpu_01_v202511.tar.gz
$ tar xzf gpgpu_01_v202209.tar.gz && cd gpgpu_01
$ mkdir build && cd build
$ cmake ..
$ make all -j
when building you get two binaries:
--help). It outputs a
PNG file after rendering the image../mandel -m CPU # run the CPU version of the algorithm
./mandel -m GPU # run the GPU version of the algorithmThe CPU version is implemented as a reference. The GPU version is of
course not implemented. The only file you need to edit is
src/render.cu: code the following function and one
or more kernels:
/// \param buffer The RGBA24 image buffer
/// \param width Image width
/// \param height Image height
/// \param stride Number of bytes between two lines
/// \param n_iterations Number of iterations maximal to decide if a point belongs to the mandelbrot set.
void render(char* buffer,
            int width,
            int height,
            std::ptrdiff_t stride,
int n_iterations = 100);The Mandelbrot set is the set of values of c in the complex plane for which the orbit of 0 under iteration of the quadratic map
\[z_{n+1} = z_n^2 + c\]
is bounded. The image is generated by assigning for each pixel the number k < N such that:
\[ k = \min \{ n \mid |z_n| > 2, n < N \} \]
If there is no such k, we set k = N. The reference uses N = 100.
The pseudo code is given here:
N = 100

For each pixel (px, py) on the output image, do:
{
  mx0 = scaled px coordinate of pixel (scaled to lie in the Mandelbrot X scale (-2.5, 1))
  my0 = scaled py coordinate of pixel (scaled to lie in the Mandelbrot Y scale (-1, 1))
  mx = 0.0
  my = 0.0
  iteration = 0
  while (mx*mx + my*my < 2*2  AND  iteration < N) {
    mxtemp = mx*mx - my*my + mx0
    my = 2*mx*my + my0
    mx = mxtemp
    iteration = iteration + 1
  }
  color[px, py] = palette(iteration)
}
where palette(x: int) -> RGBA24 is a function that
associates a color to the number of iterations. As a first step, we will
simply use a linear grayscale:
rgba24 palette(int x)
{
  uint8_t v = 255 * x / N;
  return {v,v,v,255};
}
Exercise
In the file render.cu, you have to adapt the kernel to
implement the function above. The file has two functions:
void render(char* hostBuffer, int width, int height, std::ptrdiff_t stride, int n_iterations)__global__ void mykernel(char* buffer, int width, int height, size_t pitch)The function render does the following:
char*  devBuffer;   // device pointer to the buffer to allocate
size_t pitch;       // in bytes
cudaMallocPitch(&devBuffer, &pitch, width * sizeof(rgba8_t), height);
Note that we should not use cudaMalloc because the
device may need to a special memory alignment of lines and may add byte
padding.
mykernel using a square block of
size bsize = 32.dim3 dimBlock(bsize, bsize);
dim3 dimGrid(w , h);
mykernel<<<dimGrid, dimBlock>>>(devBuffer, width, height, pitch);cudaMemcpy2D(hostBuffer, stride, devBuffer, pitch, width * sizeof(rgba8_t), height, cudaMemcpyDeviceToHost);
cudaFree(devBuffer);The kernel in itself does not do anything useful (yet!). It simply creates a gradient:
__global__ void mykernel(char* buffer, int width, int height, size_t pitch)
{
  float denum = width * width + height * height;
  int x = blockDim.x * blockIdx.x + threadIdx.x;
  int y = blockDim.y * blockIdx.y + threadIdx.y;

  if (x >= width || y >= height)
    return;

  uchar4*  lineptr = (uchar4*)(buffer + y * pitch);
  float    v       = (x * x + y * y) / denum;
  uint8_t  grayv   = v * 255;
  lineptr[x]       = {grayv, grayv, grayv, 255};
}
Note the type uchar4 used for the color type
RGBA. If you run mandel -m GPU 100 1280 720,
you will get a gradient image. You have to replace the kernel so that it
computes the mandelbrot fractal with the grayscale palette
where the maximum iteration value is mapped to white.
Instead of using the grayscale palette, we want to use a color transfer function. The heat color transfer function H(x) : (0,1) → RGB is defined as:
\[ H(x) = \begin{cases} (0, \frac{x}{0.25}, 1) & if & 0 \le x < 0.25 \\ (0, 1, \frac{0.5 - x}{0.25}) & if & 0.25 \le x < 0.5 \\ (\frac{x - 0.5}{0.25}, 1, 0) & if & 0.5 \le x < 0.75 \\ (1, \frac{1 - x}{0.25}, 0) & if & 0.75 \le x < 1 \\ (0, 0, 0) & if & 1 \le x \\ \end{cases} \]
Exercise Implement the function
uchar4 heat_lut(float x) and use it from the kernel. Note
that this function needs to be marked __device__ to be
callable from the kernel.

As you can see, the image is dominated by “cold” colors. If we want the colors to be more uniformly distributed, we need an histogram normalization. The Escape time algorithm is then coupled with the histogram coloring algorithm. Computing the histogram of the image consists in counting the number of occurrence of each value.
Input: Image K
Output: Histogram (array) of size N

histo[x] = 0 for all x;
For each pixel (x,y)
{
  k = K(x,y)
  histo[k] += 1
}
Then, for each value k, where k is a number of iteration, we normalize this value by the histogram, i.e.:
\[ LUT(k) = \text{heat\_lut}( \frac{\sum_{i=0}^k histo[i]}{\sum_{i=0}^N histo[i]} ) \]
Histogram computation is a bit tricky on GPU as we need to perform a reduction. It involves the following processing pipeline:

max_iter + 1. This step is called a reduction. For now,
just use a single thread to compute it.Implement the following kernels:
/// Compute the number or iteration of the fractal per pixel and store the result in *buffer*.
/// Note that a 32-bits location can be used to store an integer (int32) or a color (uchar4).
///
/// \param buffer Input buffer of type (uchar4 or uint32_t)
/// \param width Width of the image
/// \param height Height of the image
/// \param pitch Size of a line in bytes
/// \param max_iter Maximum number of iterations
__global__ void compute_iter(char* buffer, int width, int height, size_t pitch, int max_iter);

/// This function is single thread for now!
///
/// \param buffer Input buffer of type (uchar4 or uint32_t)
/// \param width Width of the image
/// \param height Height of the image
/// \param pitch Size of a line in bytes
/// \param max_iter Maximum number of iterations
/// \param LUT Output look-up table
__global__ void compute_LUT(const char* buffer, int width, int height, size_t pitch, int max_iter, uchar4* LUT);


///
/// \param buffer Input buffer of type (uchar4 or uint32_t)
/// \param width Width of the image
/// \param height Height of the image
/// \param pitch Size of a line in bytes
/// \param max_iter Maximum number of iterations
__global__ void apply_LUT(char* buffer, int width, int height, size_t pitch, int max_iter, const uchar4* LUT);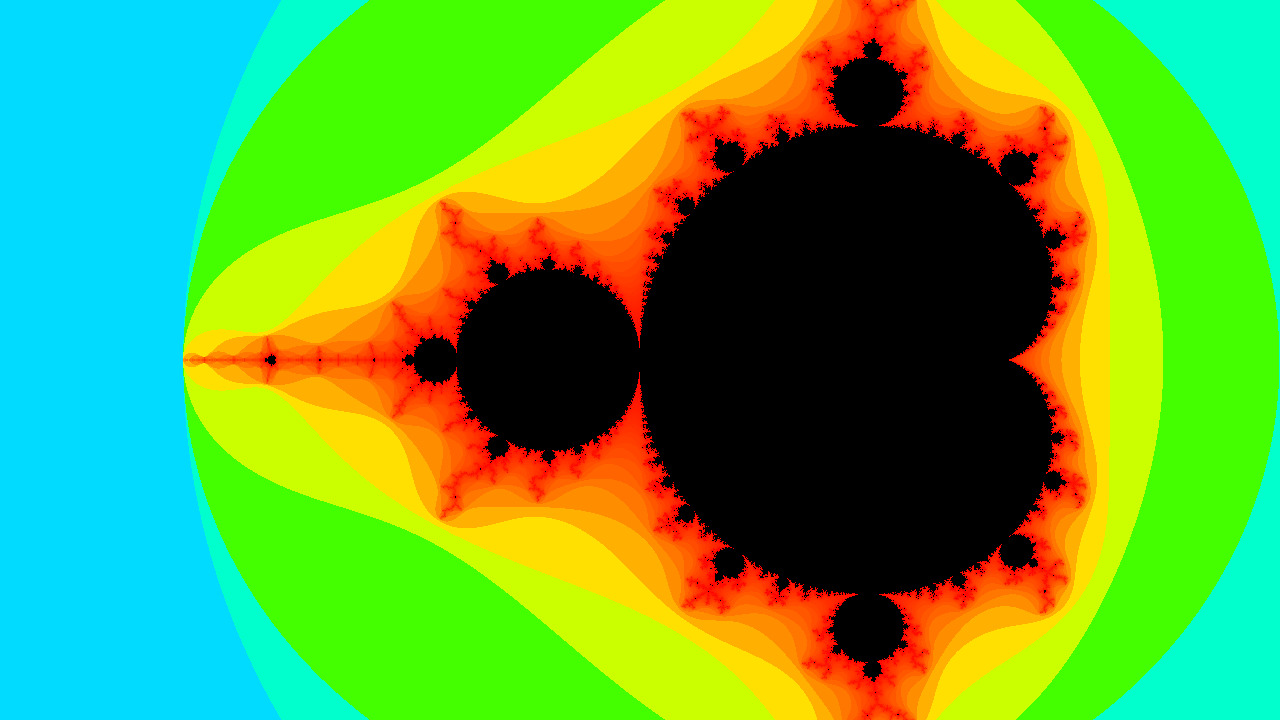
Let’s try some benchmark:
$ ./bench
2019-11-04 16:49:38
Running ./bench
Run on (8 X 3800 MHz CPU s)
CPU Caches:
  L1 Data 32K (x4)
  L1 Instruction 32K (x4)
  L2 Unified 256K (x4)
  L3 Unified 8192K (x1)
***WARNING*** CPU scaling is enabled, the benchmark real time measurements may be noisy and will incur extra overhead.
----------------------------------------------------------------------------------
Benchmark                           Time           CPU Iterations UserCounters...
----------------------------------------------------------------------------------
BM_Rendering_cpu/real_time         26 ms         26 ms         27 frame_rate=38.8819/s
BM_Rendering_gpu/real_time       5621 ms       5608 ms          1 frame_rate=0.177903/s
Let’s start doing more profiling, with nvprof (also have a look on the visual profiler to analyse results).
nvprof ./mandel
[2019-11-05 10:05:09.019] [info] Runnging GPU mode with (w=4800,h=3200,niter=100).
==4049== NVPROF is profiling process 4049, command: ./mandel
[2019-11-05 10:05:15.873] [info] Output saved in output.png.
==4049== Profiling application: ./mandel
==4049== Profiling result:
            Type  Time(%)      Time     Calls       Avg       Min       Max  Name
 GPU activities:   99.55%  5.48802s         1  5.48802s  5.48802s  5.48802s  compute_LUT_st(char*, int, int, unsigned long, int, uchar4*)
                    0.20%  11.177ms         1  11.177ms  11.177ms  11.177ms  [CUDA memcpy DtoH]
                    0.19%  10.603ms         1  10.603ms  10.603ms  10.603ms  compute_iter(char*, int, int, unsigned long, int)
                    0.06%  3.2823ms         1  3.2823ms  3.2823ms  3.2823ms  apply_LUT(char*, int, int, unsigned long, uchar4*)
      API calls:   96.16%  5.50197s         2  2.75099s  168.72us  5.50180s  cudaFree
                    3.61%  206.71ms         1  206.71ms  206.71ms  206.71ms  cudaMallocPitch
                    0.20%  11.358ms         1  11.358ms  11.358ms  11.358ms  cudaMemcpy2D
                    0.02%  949.65us         3  316.55us  21.211us  874.09us  cudaLaunchKernel
                    0.01%  337.67us        97  3.4810us     259ns  191.31us  cuDeviceGetAttribute
                    0.00%  208.84us         1  208.84us  208.84us  208.84us  cudaMalloc
                    0.00%  136.41us         1  136.41us  136.41us  136.41us  cuDeviceTotalMem
                    0.00%  35.760us         1  35.760us  35.760us  35.760us  cuDeviceGetName
                    0.00%  5.9070us         1  5.9070us  5.9070us  5.9070us  cuDeviceGetPCIBusId
                    0.00%  2.7510us         3     917ns     403ns  1.8290us  cuDeviceGetCount
                    0.00%  2.1090us         3     703ns     401ns  1.0420us  cudaPeekAtLastError
                    0.00%  1.4390us         2     719ns     327ns  1.1120us  cuDeviceGet
                    0.00%     456ns         1     456ns     456ns     456ns  cuDeviceGetUuid
As you can see, most time is spent in compute_LUT.
Exercise Think about optimizing
compute_LUT. Here are some hints:
You can get this kind of results afterward:
==9437== Profiling application: ./mandel
==9437== Profiling result:
            Type  Time(%)      Time     Calls       Avg       Min       Max  Name
 GPU activities:   35.07%  10.600ms         1  10.600ms  10.600ms  10.600ms  compute_iter(char*, int, int, unsigned long, int)
                   34.62%  10.464ms         1  10.464ms  10.464ms  10.464ms  [CUDA memcpy DtoH]
                   22.85%  6.9076ms         1  6.9076ms  6.9076ms  6.9076ms  compute_LUT_mt(char*, int, int, unsigned long, int, uchar4*)
                    7.45%  2.2520ms         1  2.2520ms  2.2520ms  2.2520ms  apply_LUT(char*, int, int, unsigned long, uchar4*)
                    0.01%  2.6240us         1  2.6240us  2.6240us  2.6240us  [CUDA memset]
      API calls:   81.14%  135.14ms         1  135.14ms  135.14ms  135.14ms  cudaMallocPitch
                   11.91%  19.831ms         2  9.9154ms  125.37us  19.705ms  cudaFree
                    6.38%  10.626ms         1  10.626ms  10.626ms  10.626ms  cudaMemcpy2D
                    0.24%  407.12us         3  135.71us  8.7660us  384.42us  cudaLaunchKernel
                    0.15%  252.05us        97  2.5980us     272ns  109.41us  cuDeviceGetAttribute
                    0.08%  140.35us         1  140.35us  140.35us  140.35us  cuDeviceTotalMem
                    0.06%  93.073us         1  93.073us  93.073us  93.073us  cudaMalloc
                    0.02%  41.026us         1  41.026us  41.026us  41.026us  cuDeviceGetName
                    0.01%  10.000us         1  10.000us  10.000us  10.000us  cudaMemset
                    0.00%  3.2660us         1  3.2660us  3.2660us  3.2660us  cuDeviceGetPCIBusId
                    0.00%  2.7800us         3     926ns     338ns  1.9230us  cuDeviceGetCount
                    0.00%  1.4510us         2     725ns     340ns  1.1110us  cuDeviceGet
                    0.00%     908ns         3     302ns     192ns     480ns  cudaPeekAtLastError
0.00% 578ns 1 578ns 578ns 578ns cuDeviceGetUuidThink about those optimizations :