Difference between revisions of "Evaltex"
From LRDE
| Line 74: | Line 74: | ||
| [[File:evaltex_histogram_accuracy.png|thumb|upright|250px|alt=Accuracy histogram|Accuracy histogram]] |
| [[File:evaltex_histogram_accuracy.png|thumb|upright|250px|alt=Accuracy histogram|Accuracy histogram]] |
||
|} |
|} |
||
| + | |||
| + | |||
| + | '''EMD metrics.''' |
||
| + | |||
| + | <math>R_{EMD} = 1 - EMD(\widetilde{h}_{Cov}, \widetilde{h}_{O}) </math> |
||
= Input format = |
= Input format = |
||
Revision as of 09:52, 13 July 2016
EvaLTex (Evaluating Text Localization) is a unified evaluation framework used to measure the performance of text detection and text segmentation algorithms. It takes as input text objects represented either by rectangle coordinates or by irregular masks. The output consists of a set of scores, at local and global levels, and a visual representation of the behavior of the analysed algorithm through quality histograms.
For more details on the evaluation protocol, read the scientific paper published in the Image and Vision Computing Journal and the Ph.D Thesis. Details on the visual representation of the evaluation can be found in the article published in the Proc. of International Conference in Document Analysis and Recognition.
| Please cite the IVC paper in all publications that use the EvaLTex tool and the ICDAR paper in all publications that use the histogram representation. |
Evaluation performance measurements
Local evaluation
For each matched GT object by a detection we assign two quality measures: Coverage (Cov) and Accuracy (Acc);
- Cov computes the rate of the matched area with respect to the GT object area
- Acc computes the rate of the matched area with respect to the detection area
The two quality metrics are adapted based on the type of matching (one-to-one, one-to-many, many-to-one or many-to-many). For more details please refer to the scientific paper published in the Image and Vision Computing Journal and the details in Chapter 3 of this Ph.D Thesis.
Global evaluation
The global evaluation consists of a set of measurements: a global recall , a quantitative recall , a qualitative recall , a "global" precision , a "quantitative" precision , a "qualitative" precision , a split metric as well as an overall F-Score value. In addition, the tool provides two histogram representations of the local qualities and a derived set of metrics ( and ) computed using histogram distances. For the comprehension of all these metrics, we define the following:
- = nb. of GT objects in the image/dataset
- = nb. of true positives (GT objects that were detected)
- = nb. false positives (detections with no correspondence in the GT)
Recall. The Recall () computes the amount of detected text and is defined as the product of two terms:
The left term of the product represents the ratio between the number of true positives and the total number of GT objects. We interpret this ratio as the quantity Recall , as it accurately describes the percentage of detected GT objects, regardless of their coverage:
The second term is get by averaging all coverage rates of the detected GT objects. Intuitively, we can denote this proportion as the quality Recall, , as it characterizes the mean of covered surface of the GT:
Precision. By applying the same reasoning, we obtain the following decomposition of the global Precision :
Here again, the left term of the product provides an insight on the percentage of detections that have a correspondence in the GT. Consequently, we call this measure the quantity precision :
Inversely, the right term computes the accuracy average obtained from the matching of the detection set and the GT. This ratio will then be referred to as the Precision quality :
Split. The Split metric evaluates the level of GT fragmentation in a dataset and is computed as:
, where =nb. of detections matching
The Split measure can be used as an individual metric or integrated in the Recall computation. For more details please refer to the scientific paper published in the Image and Vision Computing Journal and the details in Chapter 3 of this Ph.D Thesis.
F-Score. We use as an overall metric the well known F-Score defined as:
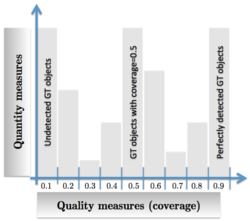
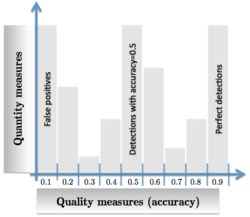
Quality histograms.
EMD metrics.
Input format
The framework takes as input .txt files containing the coordinates of the text bounding boxes and labeled images containing text masks, depending on the evaluation task. To unify the input format
Text detection tasks
Text detection results can be represented through boxes and masks. For text detection tasks using bounding boxes, a .txt file is enough. If the text objects are represented by irregular masks, then an additional labeled image will be needed.
Text box representation
GT format. The GT format contains the following attributes:
- img name
- image height, image width
- text object
- ID: unique text object ID
- region ID: region ID to which the object belongs to
- "transcription": can be empty
- text reject: option that decides if a text object should be counted or not; can be set to f (default) or t (not take into account)
- x: x coordinate of the bounding box
- y: y coordinate of the bounding box
- width: width of the bounding box
- height: height of the bounding box
e.g.: img_1.txt
| img_1 960,1280 |
Detection format. The detection .txt file format contains the following attributes:
- img name
- text object
- ID: unique text object ID
- "transcription": can be empty
- x: x coordinate of the bounding box
- y: y coordinate of the bounding box
- width: width of the bounding box
- height: height of the bounding box
e.g.: img_1.txt
| img_1 1,"",272,264,392,186 |
Text mask representation
If a more precise evaluation is needed, one can also evaluate the detection of text masks. To do so, we need, in the addition of the file format explained before, a set of labeled images, for the GT and the detection.
The interest of using masks rather than rectangles is to represent text strings, not only in horizontal or vertical configurations, but also tilted, circular, curved or in perspective. In such cases, the rectangular representation might disturb the matching process: a detection can involuntary match a GT object due to its varying direction (inclined, curved, circular).
The irregular mask annotation disables the use of the region tag. When dealing with rectangular boxes, the regions are generated automatically based on the coordinates of the GT objects. Consequently, a region is the bounding box of several "smaller" boxes. Thus, when masks are annotated irregularly, regions cannot be generated automatically.
Text segmentation tasks
To evaluate text segmentation tasks we use the same mask input format as for the text detection. In text segmentation, a mask will be considered a character and not an entire word.
Text segmentation GT format. Similar to text detection tasks using masks, to evaluate text segmentation we use, in addition to the .txt file a labeled image (each character is labeled differently). Each GT object is represented by a character. Character-level GT objects cannot be grouped into regions and consequently each text object has a different region tag. The x, y, width and height will define the coordinates of the bounding box of each character.
e.g.: img_1.txt
| img_1 960,1280 |
Text segmentation result format. The result format consists in the same labeled image as the one used for the GT and the detection .txt file containing the positions of the bounding boxes of each segmented connected component.
e.g.: img_1.txt
| img_1 1,"",383,42,103,167 |
Output format
The evaluation results are given as .txt files, in two forms: a file with the results obtained on the entire dataset and a file with results generated for each image in the dataset. The difference between the local evaluation and the global one consists in the statistics (Cov, Acc and split) for each GT object in an image.
Global evaluation for an entire dataset
|
EvaLTex statistics |
EvaLTex statistics summarize the number of GT objects, detections, false positives and true positives in the dataset.
|
Global results FScore_noSplit=0.725095 |
The global scores are the default Recall score (with integrated Split), the Recall with no integrated Split, the Precision, as well as the default FScore (with integrated Split) and the FScore without the integrated Split.
|
Quantity results |
Quantity results only refer to the number of detected text objects or the number of detections with a match in the GT regardless of the coverage or accuracy areas.
|
Quality results |
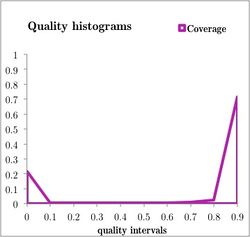
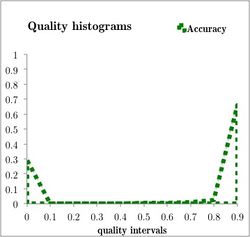
The quality results contain two histograms, representing the coverage and accuracy distributions over the dataset. e.g.
|
EMD results |
As an alternative to the global scores, we can also compute, using the EMD distance two quality scores based on the Coverage and Accuracy histograms.
Local evaluation .txt file for each image
The local evaluation file, generate for each image of the dataset, has the same format as the dataset generated file.
|
EvaLTex statistics - image img_1 Global results FScore_noSplit=0.572144 Quantity results Quality results EMD results FScore_noSplit=0.578853 |
In addition, it contains the accuracy, coverage and split values for all the GT objects in the dataset.
|
Local evaluation |
Run the evaluation
The executable EvaLTex takes as input two .txt files, one for the GT and one for the detection/segmentation.
Usage
./EvaLTex -g gt.txt -d det.txt -o output_dir/ [options]
|
Resources
Evaluation Datasets
Text detection
Text segmentation
- ICDAR 2013 Natural scene: ground truth .txt & labeled images
- ICDAR 2013 Born-digital: ground truth .txt & labeled images
Source code available soon
Credits
EvaLTex was written by Ana Stefania CALARASANU. Please send any suggestions, comments or bug reports to calarasanu@lrde.epita.fr.
| Please cite the IVC paper in all publications that use the EvaLTex tool and the ICDAR paper in all publications that use the histogram representation. |


